The dashboard serves as the initial interface that users see in the application when they log in. This is extremely important to consolidate all crucial information about data in one, centralized place. The dashboard gives you a 360-degree, comprehensive view of your business and helps you understand key performance indicators (KPI).
In Power Apps, data visualization can be achieved in various ways. This includes operational dashboards, which present information in tabular views, and analytical dashboards, which offer graphical representations for deeper data analysis using pie, bar, doughnut charts and more. For an efficient display of all necessary information, a combination of easy-to-read charts, graphs, and views in one place is recommended.
An alternative approach to gain real-time insights into Dataverse data involves using interactive experience dashboards. These dashboards allow users to filter and analyse data from various perspectives, while providing access records directly.

Single - vs multi-streams dashboards
Multi-stream dashboards
Having observed the impact of interactive dashboards in various organizations, it’s clear that these tools are essential for enhancing decision-making and fostering collaboration. They not only simplify complex data but also empower teams to respond swiftly to changing circumstances. Embracing interactive dashboards is a strategic move towards a more agile and informed business environment
Julia Topinek
Business Consultant

Single-stream dashboards
Stream view vs tile view

Visual filters

Filtering - global and timeframe filters

Advantages of interactive dashboards in Power Platform
-
Fully configurable, easy to implement and adjust to your business needs without code:
This allows you to tailor the interactive experience to your specific requirements without the need for extensive coding, technical knowledge or effort. -
Security-role based access:
You can control the visibility of the interactive experience for selected roles, ensuring that sensitive information is only accessible to authorized individuals. -
Real-time data:
The interactive experience provides access to real-time data, allowing for up-to-date insights and analysis. -
Focus on detailed data:
Interactive experience dashboards enable a deep dive into detailed data, facilitating thorough analysis and understanding. Overall, employing interactive experience offers a versatile, user-friendly, and secure approach to delivering and managing information within your organization -
Wide spectrum of layouts:
A diverse range of dashboards and charts layouts is available. -
Possibility to move across environments using solutions:
Easy transition across different environments, providing flexibility and adaptability.

Contact Us
See the latest insights from Netwise
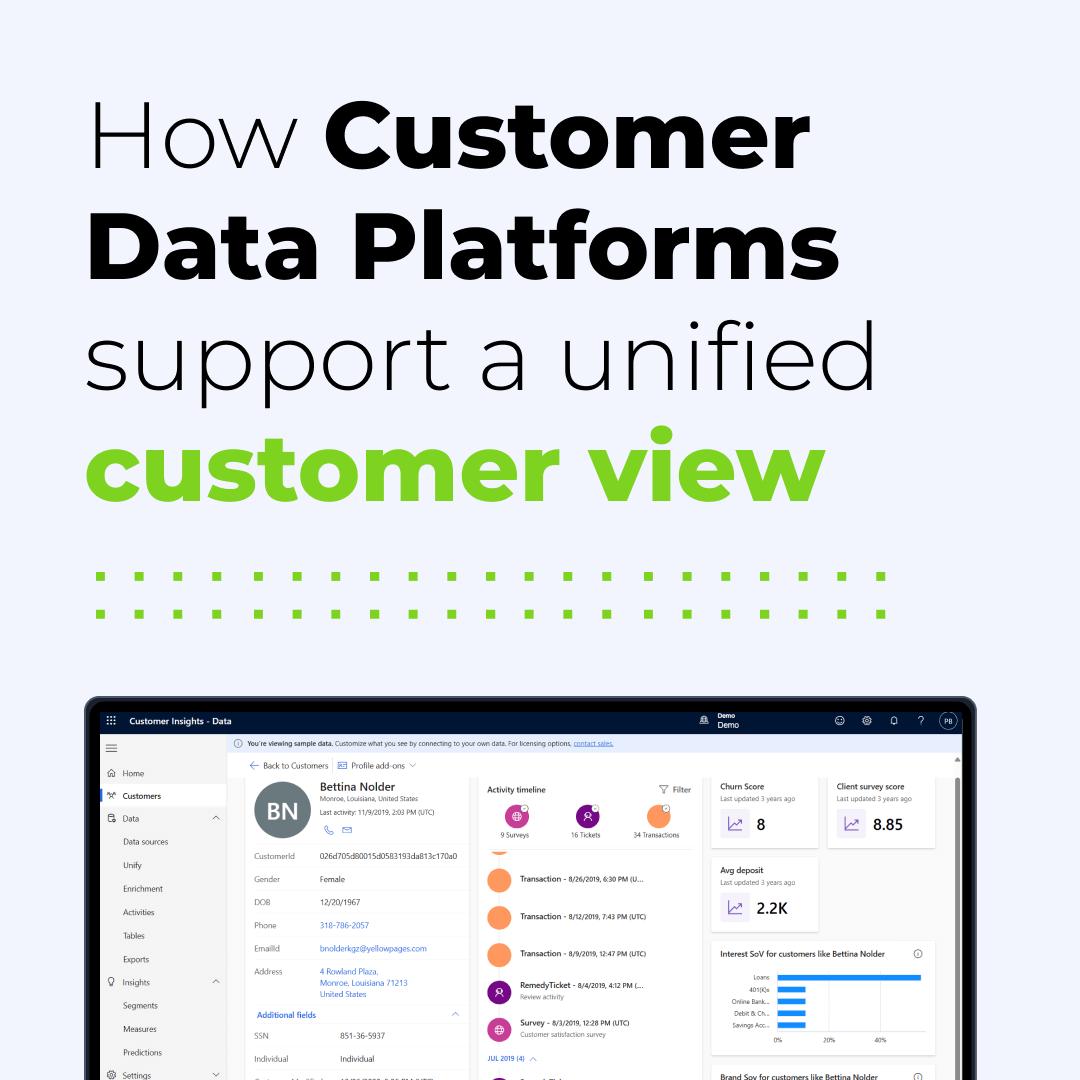
How Customer Data Platforms support a unified customer view
How Customer Data Platforms support a unified customer view When discussing customer strategy with clients, I find the terms CDP and Customer 360° used very often. They have become quite common buzzwords in many industries. However, while everyone wants that…
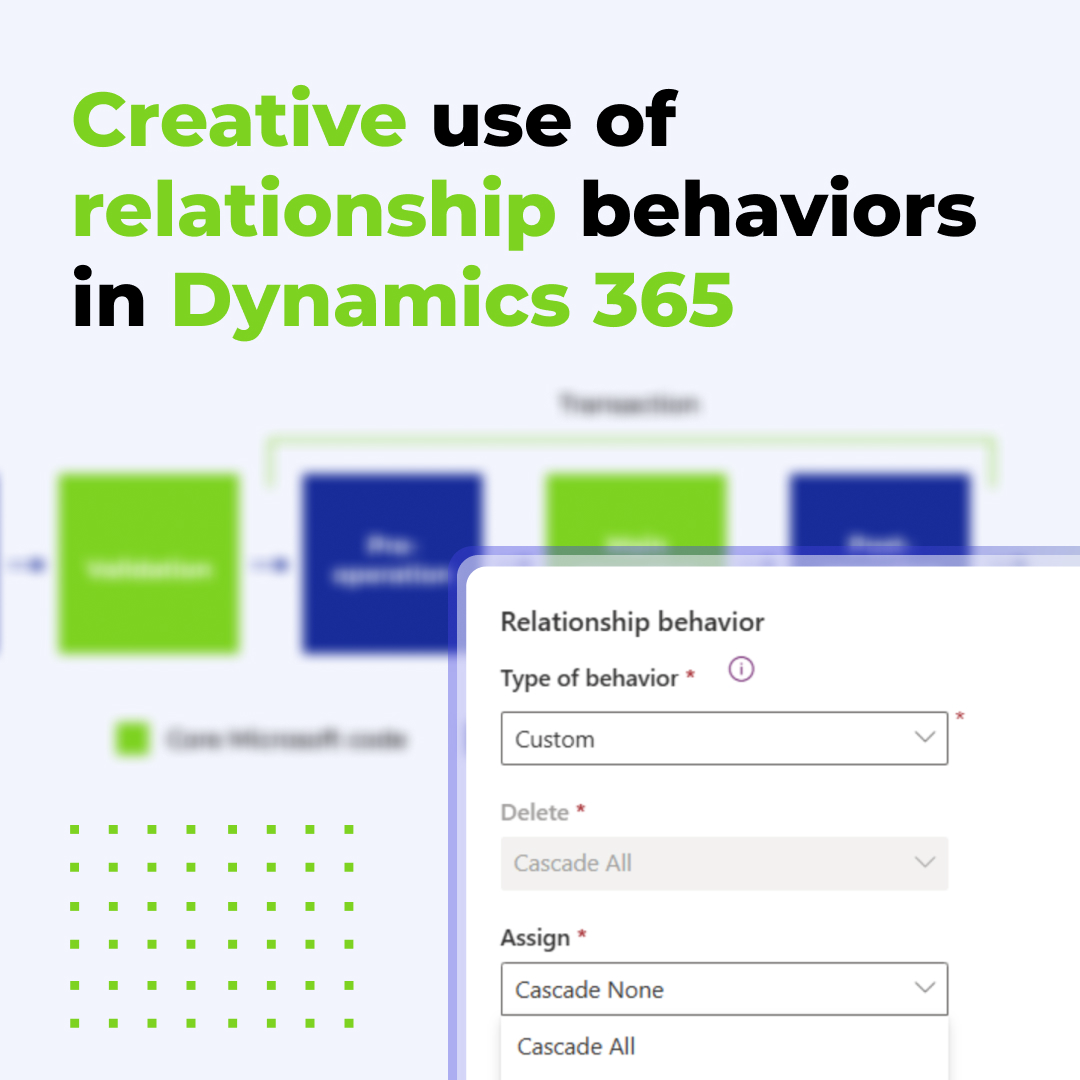
Read moreCreative use of relationship behaviors in Dynamics 365: How removing data from the Target field saved our project
In this article, we show how a unique client need led to a simple, creative solution beyond standard Dataverse features.
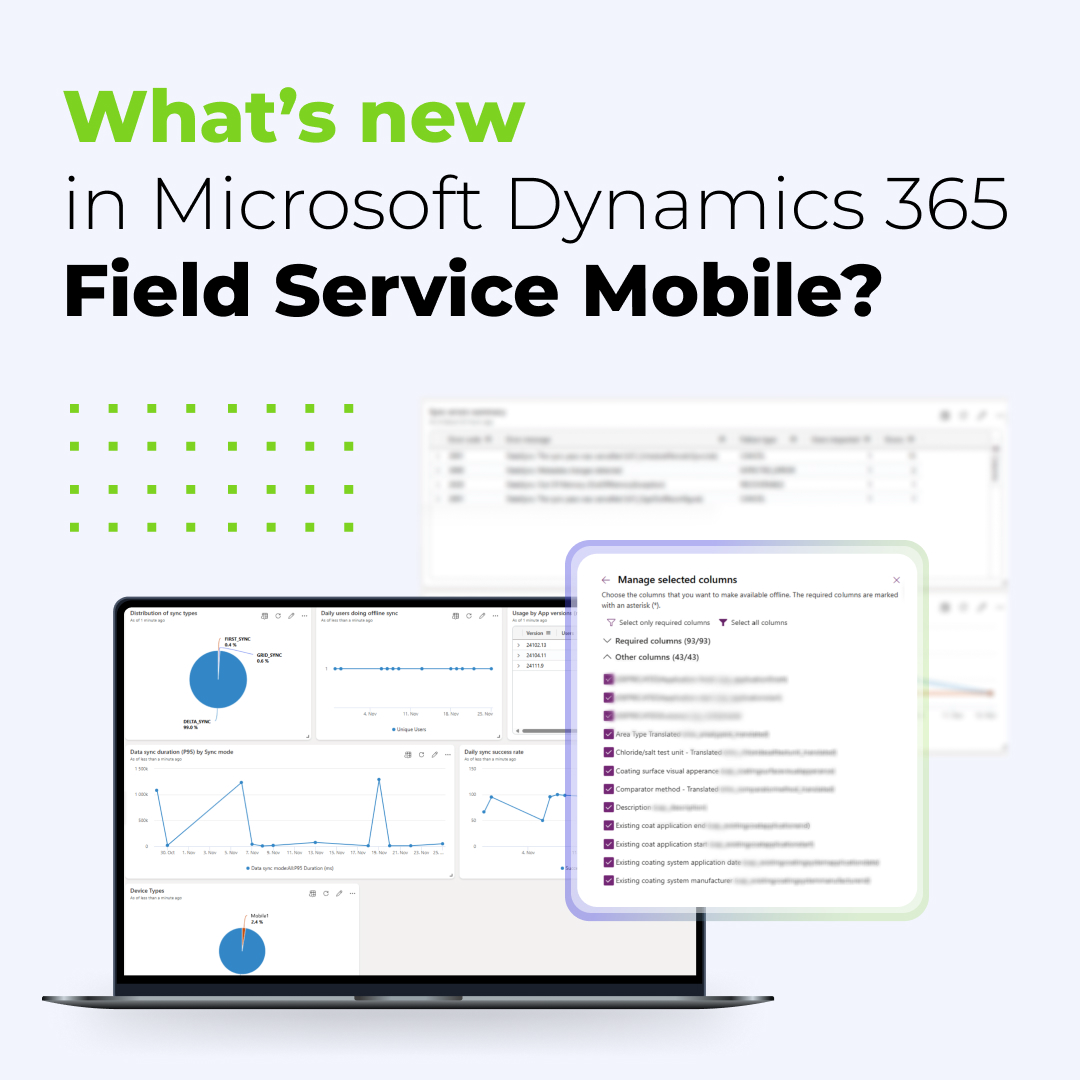
Read moreWhat’s new in Microsoft Dynamics 365 Field Service Mobile? (2025 Guide)
Discover new D365 Field Service Mobile updates enhancing performance and offline reliability for field teams.
Read more

